by Dr Rebecca Williams
 |
| What I'm thinking about...a word cloud of my 2008 paper validating Titan2D |
This summer I plan on thinking about lahars as a refreshing
change to troubling over pyroclastic density currents, which are ‘my thing’.
Pyroclastic density currents (PDCs) are mixtures of hot gas, ash, pumice and
blocks of rock that flow down the sides of volcanoes during catastrophic
eruptions. They are what I’ve spent most of the last 7 years thinking about.
 |
|
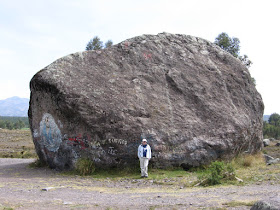
A boulder carried by a lahar from Volcán Cotopaxi in 1877. A
much younger me for scale.
|
Lahars, on the other hand, are flows made of water, volcanic
material, and whatever else they can erode including soil and trees. The word lahar is Indonesian and roughly
translates to volcanic mudflow. They range from dirty water to flows so laden
with material that they have the consistency of concrete and can carry boulders
the size of a house!
Between 1600 and 2010 AD lahars caused 44,252 deaths, so they are pretty deadly. This is because they can travel great distances (The Chillos Valley Lahar flowed from Volcán Cotopaxi to the Pacific Ocean – that’s 326 km!) and at great speeds (>85 km/hr). They can form during a volcanic eruption if
hot ash is erupted onto snow and ice at the top of a volcano. But they can also form when the volcano hasn’t erupted for a long time if heavy rainfall erodes the loose volcanic deposits on the sides of the
volcano. This makes it very difficult to know when one might happen - they can take communities by surprise. Lahars can be
big, or small, fast or slow and contain lots of debris, or be very watery. If
they are so different, how can we begin to try to figure out where they might
flow or how fast?
 |
|
The Vazcún Valley with Baños in the foreground.
The El
Salado baths are circled.
Volcán Tungurahua’s summit is hiding in the clouds
|
I last thought about this problem for my Masters dissertation, which I did at the University of Buffalo. Then, I was working amongst a large collaborative effort to create computer simulations of hazardous volcanic flows. When I joined UB Titan2D (their computer model for simulating PDCs) was well established and they were just starting to adapt the mathematical equations to use it for modelling lahars. I was given the task to see if it would work, and to see if it could be used to predict where lahars might travel and how fast they might flow.
On the 12th of February, 2005, a small ash-rich lahar travelled down the Vazcún Valley which drains Volcán Tungurahua through the town of Baños, Ecuador. This lahar was triggered by heavy rainfall eroding recent ashfall deposits. The lahar swept past the El Salado baths, much to the surprise of the bathers enjoying the volcanic springs here. It travelled 10 km at speeds of up to 7 m/s. In the summer of 2005, me and some colleagues mapped the deposits left behind by this lahar. Back in the office I used Titan2D to simulate a lahar travelling down the valley and compared where the model said it would go and at what speeds to what we knew from the field survey. Turns out, the model did a pretty good job. The area that the model predicted would be covered matched pretty closely with what we mapped and the predicted thickness of the flow was within 4% of the measured flow thickness. But, the velocity of the simulated flow was only within 17–67% of the velocities recorded during the event, depending on what we told the model to simulate. So something wasn’t quite right.
Video of a Titan2D simulation of the Vazcun Valley lahar.
Williams et al., 2008. Evaluation of the Titan2D two-phase flow model using an actual event: Case study of the 2005 Vazcún Valley Lahar. Journal of Volcanology and Geothermal Research 177 (2008) 760--766
This paper can be found here or contact me for a copy. Tw: @volcanologist
This paper can be found here or contact me for a copy. Tw: @volcanologist


No comments:
Post a Comment