Wednesday 5 June 2019

Making waves and moving sediment

Dr Hannah Williams has been a Post-Doctoral Researcher in Physical Geography at the University of Hull since April 2017. Hannah is part of the Hydralab+ project, a large European project that brings together researchers to improve experimental hydraulic research to better address climate change adaptation issues. Here she talks about a recent set of experiments carried out at the Total Environment Simulator.

Mixed Sediment Beaches are commonly found at high latitudes around the world, including amongst other locations, along the coastline of the United Kingdom. These types of beaches can consist of a mixture of both sands and gravels, and behave differently under hydrodynamic forcing, such as waves, to those made up of a single sediment size. Although some research, mainly in the 1970s-1980s, has been carried out to gain an understanding of the morphological behaviour of these types of beaches, little is still known about the variations in the morphology of these beaches due to mixed sediment, and how they respond to the hydrodynamic conditions.  The aim of this study was to try and gain some insights into beach response using a physical model.

At the University of Hull, we are lucky that we have a large experimental flume available for research called the Total Environment Simulator (TES). The TES has a working area of 11m by 6m, and is equipped with pumps to allow recirculating flow and sediment, a multi-paddle wave generator for the generation of both regular and irregular waves up to ~0.3m in height (depending on water depth), and finally is equipped with a rainfall generator sprinkler system on the roof. During my time at the University of Hull, I have been involved in experiments using all of these systems, demonstrating just how versatile the flume is. The photo below shows the TES when it first opened in 2000. As a well-used facility, it doesn’t look quite so clean anymore!  


For these particular experiments we were only interested in the beach response under wave loading, so only the wave generator system was required. We constructed a large beach across the opposite end of flume, with a height of 0.8m at the rear, and extending 5m towards the wave paddles. This gave the beach an initial gradient of 1:7.5.To obtain a mixed beach, we chose two different sediment sizes with a large difference in diameter. The fine sediment had a D50=215μm (often known as play sand as it is commonly used in children’s sand pits), whilst the coarser sediment had a D50=1.6mm. To construct this beach, this required over 5 tonnes of each type of sediment (and this including bulking out some of the area deep underneath the beach with breeze blocks), which all had to be lifted into the flume and distributed by hand. The photo below shows the initial smooth beach conditions. 


In terms of measurements, there were two main parameters we were interested in, firstly the incoming wave conditions. To measure these, we had 8 acoustic wave gauges distributed throughout the flume (see below). These recorded information about the wave heights and periods, from which we can gain an understanding of the transformation of the waves as they approach the beach. 


The second parameter we were interested in was the beach morphology. To measure this, we deployed a Terrestrial Laser Scanner. This was mounted from the ceiling above the beach. After each experimental run, the water was drained from the flume, and the 
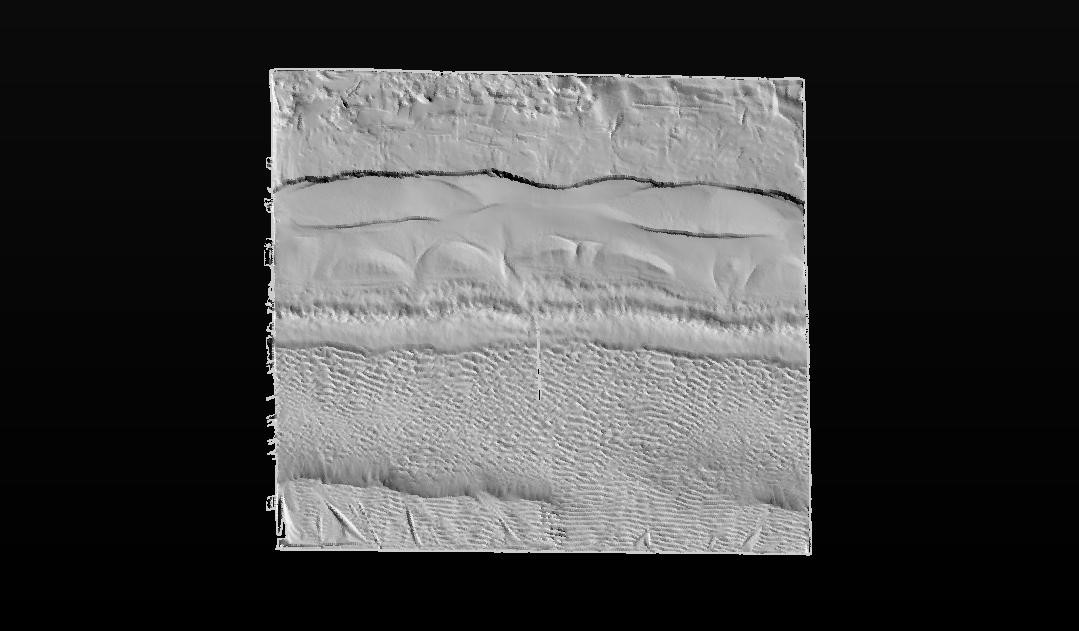
scanner carried out a full 360 degree scan of the beach surface.The image below shows an example of a TLS scan, in which you can clearly identify the top of the swash zone, as well as a berm which has formed part way down the beach, and ripples in the lower section. 


For the actual experiments carried out here, we attempted to replicate some of the influence of the tidal cycle on the response of the beach. The experiments were run at three different water depths, namely 0.3m, 0.4m and 0.5m. In three of the experiments, we hit the beach with an initial storm (H=0.18m, T=2.2s, where H is wave height and T is wave period), at different points in the tidal cycle. One at high tide, then one at mid-tide on the flood tide, and one at mid-tide on the ebb tide. The purpose of this was to try and investigate the effect that timing of the storm with relation to the tidal cycle has on the beach response. After each storm a number of recovery events (H=0.10m, T=1.5s) were carried out, at each depth to complete a tidal cycle. The video below shows some of the experiments in action.


Using the laser scans, we can also examine the differences between scans, giving us an idea of the evolution of the beach throughout the experiments. From these we can obtain information about the amount of erosion and accretion at different points of the beach, and examine if this is different depending on when the storm occurred. The image below shows an example of a Digital Elevation Model of Difference, from which a number of interesting observations can be made.  It should be noted that Red shows accretion of sediment, whilst blue shows erosion of sediment. 


The very top of the beach remains white, this shows that the beach level here remains constant throughout the experiments, due to the wave run-up not reaching this point. Just below this section is a large area of erosion, this is the swash zone, where waves are breaking. This is a very energetic area which results in a large amount of sediment transport, mainly transported further down the beach to the zone showing large accretion. This is known as a berm and often forms as the wave deposits sediment. Below this area, it can be seen that ripples form. This is prior to the wave breaking where sediment movement occurs in an elliptical motion, forming small ripples on the surface. These are all features that are not unique to mixed sediment beaches, however, one feature that is, are the beach cusps. These can be identified in the figure by the regular arc shapes present. There is limited information on the origin of beach cusps, but once they have been created they are a self-sustaining formation. This is because as a wave hits the area of the beach with the cusp, it splits at the point and the water is forced either side. As the wave then breaks, the coarser sediment falls out of suspension and is deposited on these points (known as horns), whilst the water flows into the arc (also known as an embayment) where it in turn erodes out the finer sediment.

These experiments have only just finished, so analysis of the results is still on-going, but hopefully we will have gained some useful insights into the behaviour of mixed sediment beaches which can be used to help devise beach management plans in the future.

For more information on the work of the Hydralab+ project, then please visit: https://hydralab.eu/ 

Sunday 10 March 2019

Hull’s Protest Stickers


Dr Hannah Awcock has been a Lecturer in Human Geography at the University of Hill since January 2019. Hannah is interested in the cultural and historical geographies of resistance. Here she uses protest stickers to investigate Hull’s radical culture.


Stickers of all kinds are a common sight on the streets of towns and cities across the world. Stuck to lampposts, bins, utility boxes and other street furniture, most people probably don’t give them a second glance. Stickers on the street are temporary; some are gone in days, removed by people who didn’t like them or who picked them off when they got bored waiting for a bus. Others take months or even years to disappear, gradually erased by the weather or covered up by more stickers. Stickers come in a huge range of shapes, sizes, and designs: some are handmade whilst others are printed; some are only text, others use a combination of text and images; some are black-and-white, but most use colour. They are used for a range of purposes, including advertising and street art. Sometimes their purpose isn’t clear. I am interested in stickers that make a political statement; I call them protest stickers. Activists and campaigners use protest stickers as a way of claiming space and publicising their message. They can tell us a lot about how activists and protesters engage with public space.


Protest stickers like the one above are small stickers that covey a political message. They can be found in public spaces all over the world. Protest stickers can reveal a lot about the city they are in; they can tell you a lot about the local radical culture. Whenever I go somewhere new for the first time, I photograph the protest stickers I find. When I moved to Hull in December 2018, I was curious to get to know the city and see which protest stickers I would find. What I discovered is a wide range of protest stickers on a range of topics, as the selection featured below demonstrates.


 Anti-fascism is one of the most common topics of protest stickers—there is a strong tradition of ‘stickering’ amongst anti-fascist groups. There is also a strong association between anti-fascism and music, as this sticker suggests.


Whilst a lot of protest stickers relate to specific issues, some are quite general. This sticker is emphasising the importance of solidarity, one of the core concepts of activism of all kinds. Solidarity is the practice of offering practical, financial, and moral support to other activist groups and campaigns. The white ‘A’ in a circle is a symbol of anarchism.


Since the EU Referendum in June 2016, Brexit has been a popular subject of protest stickers, produced by both Leavers and Remainers. This sticker is produced by the EU Flag Mafia, which sells a wide range of anti-Brexit merchandise (you can by 100 stickers for £6 if you are interested, and they have several different designs).


This is one of the most unusual sticker topics I have ever found, and I have never found this sticker anywhere else but Hull. Biafra was a secessionist state in eastern Nigeria between May 1967 and January 1970. Biafra’s attempt to become an independent state sparked the Nigerian Civil War. The Nigerian military government effectively starved the people of Biafra into submission, and they surrendered. Some groups still continue to campaign for Biafran independence, and I would love to know what the connection is between these campaigns and Hull!


This is an example of a handmade sticker. It is playing on the double meaning of ‘colour,’ referring to both race and the more literal interpretation, as in red, blue, yellow, etc.


This sticker was produced by the Anti-fascist Network, but it is also promoting an anti-racist message. Three slanted arrows in a circle is a common symbol used by anti-fascist groups. It shows how protest stickers can be territorial, by claiming the surrounding area as an anti-fascist space.


This sticker demonstrates what can happen when stickers are not removed quickly. It has been partially peeled off, and large parts of the rest have faded away. I have seen this sticker before, so I know what it says. It reads “Fight War not Wars,” which is derived from the popular 1960s anti-war slogan “Make Love not War.”


This is another sticker that I have never seen anywhere else but in Hull. Protest stickers promoting vegetarianism and veganism are relatively common however. This sticker is encouraging the viewer to watch Earthlings, a 2005 documentary about how humanity uses animals in a variety of ways. Its design is simple and there is quite a lot of text. On way of analysing stickers is to think about how effective their design is. For example, which of the stickers in this post do you think is most likely to make you stop and read it if you saw it in the street? Why is this?


Most protest stickers are left-wing and/or progressive. Sometimes, however, I come across a particularly unpleasant sticker like this one. It is accusing all refugees of being prone to violence against women. In recent years, women’s rights have increasingly been used as an excuse for anti-immigrant sentiment, which could be related to the rising number of women in right-wing groups. The sticker was produced by Combat 18, a violent neo-Nazi terrorist group formed in the UK in 1992.


This isn’t strictly speaking a protest sticker, but I wanted to end on a positive note! Jean Bishop is a local hero in Hull, having raised almost £120,000 for Age UK over the last two decades armed only with a collection tin and a bee costume. She has been an inspiration to the city for some time, and in 2017 was awarded and British Empire Medal for her efforts.

In this post, I have attempted to show the wide variety of protest stickers that can be found on the streets of Hull. Perhaps next time you are out and about in the city, you will start to notice them too!

If you would like to see more of the protest stickers I have found on my travels, you can view them on my blog: https://turbulentlondon.com/category/protest-stickers/


Thursday 28 February 2019

Visitors at an Exhibition


Dr Ruth Slatter has been a Lecturer in Human Geography at the University of Hull since January 2018. Ruth is interested in how individuals experienced institutional spaces during the nineteenth- and early twentieth-century. Here she talks about her recent trip to Chicago’s Newberry Library and her research into nineteenth-century international exhibitions.

Historical geographers, historians and design historians have long been interested in international exhibitions. These discussions often beginning in 1851, the year Queen Victoria and her husband Prince Albert triumphantly opened the Great Exhibition in London. Famous for its glass, greenhouse-like temporary building, which became known as the Crystal Palace, the exhibition displayed industrial, designed and natural products from across the world. During the rest of the nineteenth- and early twentieth-centuries this exhibition set a precedent which was replicated across Europe, America and Australia.


 J. McNeven, The transept from the Grand Entrance, Souvenir of the Great Exhibition 
© Victoria and Albert Museum


Bringing together representatives from each of the represented nations, these exhibitions were – what we would now refer to as – megaevents and played an important role within the colonial politics of the nineteenth-century western world. Like today’s Olympic Games, World Cups, or Cities of Culture designations, these events were an opportunity for cities to be shown off to an international audience; for countries to demonstrate their wealth, cultural capital and political influence; and for competing nations and empires to gain an international reputation for innovative design, beautiful craft, or even rich natural resources.

Sèvres porcelain, displayed at the 1862 International Exhibition as part of the French display 
© Victoria and Albert Museum


Sir George Gilbert Scott, The Hereford Screen, displayed at the 1862 International Exhibition 
© Victoria and Albert Museum


However, these exhibitions also created the opportunity for all members of western societies – from Lords and Ladies to pit men and match stick girls – to see the world in their back yard. Therefore, my research into these events combines traditional discussions about their political purposes, with consideration of how visitors experienced them. My research has largely focused on London’s 1862 International Exhibition – the rather poor and under considered relative of the earlier 1851 Great Exhibition. Working with Helen Creswell, curator and design writer, I have been exploring peoples’ sensory experiences of these events, asking questions about the extent to which visitors engaged with their underlying political purposes and considering them as part of the urban spaces in which they were located.


Edmund Walker, Exterior of the International Exhibition of 1862 
© Victoria and Albert Museum

In November 2018 I was invited to speak at the Newberry Library in Chicago about this research. They had organised an exhibition about the 1893 Chicago World’s Fair (the American term for an International Exhibition) using their extensive collection of related material and organised a set of related public events. 

In this talk I explored a number of different ways in which we can discuss visitors’ experiences of these events. Considering the designs, the ground plans and the guidebooks made for these events, I spoke about the scale of these buildings, how they were confusing to navigate and therefore left visitors feeling exhausted and bemused. Engaging with commentaries written about these events in contemporary newspapers and magazines, I reflected on the many sounds that would have been heard in these spaces: the clatter of working machines, the tinkle of piano keeps, the chime of porcelain cups in the tea room. With reference to images of these spaces published at the time, I emphasised the importance of thinking about what visitors’ touched while in these spaces, how their bodies were often pressed together during busy periods and how they would also have brushed up against exhibits in often cluttered exhibition spaces. And, positioning these exhibitions within their urban contexts, I discussed how visitors’ experiences of these spaces were not only informed by what they saw, heart or felt in these spaces, but also their experiences of the (generally crowded) public transport and roads they used to arrive and depart from these events, the hotels and hostels they stayed in, and the character of the city in which these exhibitions were located.


And you can also listen to a podcast I recorded for the Newberry Library, going into a bit more detail about the 1862 International Exhibition in particular here: https://soundcloud.com/newberrylibrary/the-1862-intl-exhibition-revisited

Tuesday 26 February 2019

Climate, dispersal, civilisation and collapse

Dr Jonathan Dean has been a Lecturer in Physical Geography at the University of Hull since February 2017. Here he draws on work carried out with the British Geological Survey to investigate the links between climate and humans.

Why did some Homo sapiens, after evolving in eastern Africa and living there for tens of thousands of years, decide it was time to up sticks and move to Asia? Why did cities and vast empires in the Middle East collapse suddenly around 4,000 years ago, and again 3,000 years ago? People have often proposed a link between climate change and the course of human history, but to test these theories we need to know exactly how the climate changed back through time. That’s where people like me come in. My job is to work out how climate changed in the past. Because there are no meteorological records going back more than a few hundred years, we have to come up with clever ways to reconstruct past climate. I use lakes as a historical rain gauge. In some lakes, carbonate – which is like the limescale in your kettle at home – forms every year in the surface waters. In this carbonate, there are different types of oxygen, and the ratio of one type of oxygen to another varies depending on factors such as how deep or shallow the lake was at the time it formed. This carbonate then falls through the water to the lake bed and is locked away as an archive of lake level change…until scientists come along. We drill into the sediments to take cores. We then analyse the ratio of one type of oxygen to another at different points back through time from the carbonates in these sediments, and from that can reconstruct changes in lake level, and hence climate changes between wet and dry, back through time.


Lake sediments about to be analysed in the lab.


Let’s consider two examples of how climate change might have changed the course of human history. Firstly, why did our species, Homo sapiens, leave Africa after evolving there? Scientists have found evidence of Homo sapiens in the Middle East as far back as 130,000 years ago. However, other researchers have analysed the DNA of modern humans and concluded that modern non-Africans are likely to be descended from people who left Africa via Egypt around 60,000 years ago, suggesting the people who left 130,000 years ago died out before they could successfully populate the rest of the world. But why did Homo sapiens leave Africa? Maybe climate change played a role. We have used sediments taken from an old lake on the border between Ethiopia and Kenya. We showed in a paper published last year that there was a climate shift in eastern Africa at the time the successful dispersals out of Africa occurred around 60,000 years ago – the climate was changing from being very variable with multiple fluctuations between wetter and drier conditions, to a more stable climate where there was less change. During the more variable times, it was difficult for Homo sapiens, and only those who adapted to each climate change survived. This led to natural selection for the most flexible, highly skilled individuals and populations. When the climate then became more stable, it was easier for Homo sapiens to survive so populations increased. This led to pressure, as more and more humans tried to survive on the food and water resources of eastern Africa. This may have therefore pushed some people out of the region in order to try to find new lands to live on, and because of the natural selection during the times of variable climate they had the skills required to migrate out of Africa.


A dry lake bed in Ethiopia that we drilled to retrieve sediment cores (Photo Julian Ruddock).


Our second example brings us much closer to the present day. Between the time of the migration out of Africa and 5,000 years ago, humans had started playing musical instruments, developed farming and invented the wheel. But at approximately 4,000 years ago and again at 3,000 years ago it seems big civilisations ‘collapsed’ – the archaeological evidence suggests they either went into decline or ceased to exist all together. Again, climate change has been used to help account for these sudden events. A drought lasting several hundred years has been identified ~4,000 years ago in climate records from lakes in the Middle East – for example in our record from a Turkish lake that was published in a paper in 2015. In Egypt, the Nile floods failed, leading to famine and political upheaval, and they even stopped building pyramids for a few hundred years. Around 3,000 years ago we identify another drought, at the time the Hittites, who lived in central Turkey, went into decline. Nowadays in central Turkey, there is only roughly 300 mm of precipitation a year and even with modern technology agriculture is difficult. But at the times of these ‘collapses’ we have shown it would have been even drier. These droughts may have weakened civilisations and combined with civil conflict, invasions and population pressures to cause the ‘collapses’. We will never know for sure what killed off these civilisations, but what we can say is that it would have become much more difficult to grow crops, and hence for people to feed themselves, during these droughts.

Therefore, climate seems to have been a major force in shaping the course of human history – from explaining the migration of early Homo sapiens out of Africa, to contributing to the collapse of civilisations. There are important lessons for the future here. The Middle East is likely to bear the brunt of climate change this century, with drier conditions due to falling precipitation and increased summer evaporation. Eastern African is predicted to see some large climate changes too. Already politically volatile regions, fighting over water resources is likely to intensify conflicts this century. In the Middle East, it may become as dry as it was at the times of the droughts 4,000 and 3,000 years ago, and the question is whether modern technology and politics will prevent the ‘collapses’ of civilisations that we saw in the past.

(A version of this blog was first published on the BGS Geoblogy.)