Showing posts with label General GEESology. Show all posts

Wednesday, 27 July 2016

Vanadium: the 'beautiful metal' that stores energy

Helena I. Gomes,  and Helen Abigail Baxter.
 
An unheralded metal could become a crucial part of the renewables revolution. Vanadium is used in new batteries which can store large amounts of energy almost indefinitely, perfect for remote wind or solar farms. And what’s more there is loads of the stuff simply lying around in industrial dumps.

Don’t let the dumpster diving put you off – never mind gold or silver, vanadium may just be the most beautiful metal of all. It’s the 22nd most abundant element in the Earth’s crust, though it’s rarely found naturally in its metallic form. Instead, vanadium can be found in more than 100 different minerals.

Colours of vanadium. Steffen Kristensen

Once extracted and dissolved in water, various forms of vanadium turn into bright, bold colours. It’s even named after “Vanadis”, the old Norse name for the Scandinavian goddess of beauty, Freyja.
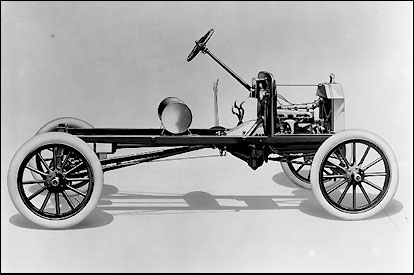
Vanadium is not only beautiful, but also strong. Adding small percentages of it creates exceptionally light, tough and more resilient steel alloys. Henry Ford was the first to use it on an industrial scale, in the 1908 Model T car chassis, and today the vast majority of vanadium is used in structural steel, mainly to build bridges and buildings.

Vanadium flow batteries

The unique properties of vanadium make it ideal for a new type of batteries that may revolutionise energy systems in the near future – redox flow batteries.

Batteries store energy and generate electricity by a reaction between two different materials – typically solid zinc and manganese. In flow batteries, these materials are liquid and have different electric charges. Both are pumped into a “cell” where the electric current is generated. A tiny membrane separates the two liquids, so they are able to react but don’t come into direct contact.
Vanadium is used in these batteries as it can convert back and forth from its various different states, which can carry different positive charges. As only one material is used, the risk of cross contamination is eliminated. The liquids have an indefinite life, so the replacement costs are low and there are no waste disposal problems. Also, the battery is extended to a potentially infinite lifetime.

Vanadium flow batteries.

In flow batteries, the energy production and capacity are independent. Energy is stored in tanks, whereas the capacity depends only on the amount of liquid stored. This provides a great design flexibility that other batteries do not allow. They are also safer, as the two liquids don’t mix causing a sudden release of energy. Even President Obama is impressed.

The new energy reservoir

Vanadium flow batteries are too big and heavy to replace the lithium batteries found in your phone, however. These batteries are instead used for large stationary long-term energy storage, or to supply remote areas, or provide backup power. They’re the basis for a more efficient, reliable, and cleaner electrical energy market.

Energy storage is one of the main factors limiting the spread of renewables. When solar and wind power is produced at the wrong time of day we need to store it to use it during the evening demand peaks. Studies have shown that vanadium batteries can be a sustainable solution.

When we can create huge stores of energy to access as required, we will be liberated from the need to maintain rapidly-accessible energy generation such as coal or gas. Vanadium batteries can be a reservoir of energy much in the same way as we use actual reservoirs to store rainwater for later use.

Strengthened with vanadium. The Henry Ford / Life magazine

The ability to store electricity would reduce reliance on gas and coal. In turn this would increase fuel security and cut CO2 emissions, helping to meet agreed emissions targets. No wonder then that the EU considers vanadium a critical metal for strategic energy technologies.

The hunt for vanadium

The metal is mined, and supplies are currently dominated by China, South Africa, Russia and the US. Vanadium has a medium risk of supply shortage and a high political risk.

However, as vanadium can be a byproduct of other sorts of mining, about 70% of the vanadium above ground is unused, left in industrial wastes such as mine tailings, debris or steel slags. In fact, a study I published with colleagues last year estimated that 43% of the annual global production of vanadium could be recovered from alkaline wastes, such as steel slag, red mud, fly ashes from coal energy production, and construction and demolition waste.

But there isn’t yet a firmly established technology to recover this vanadium. Certain bacteria and fungi can extract more vanadium from industrial wastes, and various solutions for turning this into useful metal are under development. But we still need to come up with a better way to reach potential sources of this beautiful metal.

The Conversation
Helena I. Gomes, Postdoctoral researcher in Environmental Sciences, University of Hull and Helen Abigail Baxter, Post Doc Research Assistant, Department of Geography Environment and Earth Sciences, University of Hull

This article was originally published on The Conversation. Read the original article.

Wednesday, 12 August 2015

Freecycle - blurring the analyses of consumption

Guest blog by Sally Eden

Ever eBayed, Freecycled or Shpocked something that you owned but no longer needed? Millions of us have and the fact that the names of these websites/groups are now verbs indicates how common digital practices of selling or exchanging used goods online have become between consumers. I have been giving away and receiving consumer items for free through two of my local Freecycle groups for some years in my spare time. But after twenty years, on and off, of analysing sustainable consumption professionally, I grew more intrigued by whether there was more to Freecycling than avoiding landfill by passing stuff on to others, instead of taking it to the dump (as some Freecyclers like to describe what they do) and wrote a paper about it, which has now been published in the Journal of Consumer Culture.

Why analyse Freecycle? First, Freecyclers do a lot of ‘moral ordering’ in support of sustainable and ethical consumption. That is, their online posts re-value items, changing them from something unwanted by the owner to something useful for someone else. Someone might offer broken paving slabs for crazy paving, used bricks to make someone else a BBQ or even an old washing machine door taken not as a replacement part, but to make a dome-like window in a garden fence so that the new owner’s dog could peek out and see the world, a free alternative to the ‘PetPeek’ window sold online - thanks to Richard Lamin for telling me about that! Freecycling practices thus reimagine and reproduce both products and consumers in sometimes surprising ways.

Freecycling also exposes the problems with three common ‘binaries’ (that is, two-fold oppositions or assumptions) that underlie many analyses of consumption. First is the assumption that consumption is separate from production, whereas in Freecycling, the consumer also offers and describes items online, becoming a sort of producer and retailer. This is even more obvious when spare plants or food from an allotment glut is offered. George Ritzer and others have written about the blurring of consumption with production as ‘prosumption’ – to emphasise that these different practices cannot be easily teased apart – and examples also include a consumer reviewing a book that they have read on a retailer’s website that helps the retailer to sell more books or a consumer who blogs about cosmetic products on YouTube supported by commercial adverts.

Second, Freecycling merges digital and material practices. Often we hear about the rise of online consumption crushing the High Street and other ‘brick and mortar’ stores, but in reality these different spaces are linked. Freecycling uses online systems to connect offerer and receiver, but they usually meet in person to exchange the physical item, similar to the way that some stores now offer ‘Click and Collect’ mode for buying online but collecting in person. In other cases, people ‘window shop’ in bricks-and-mortar stores to choose an item by looking and perhaps trying it on, but ‘Windows shop’ online to compare prices and finally buy it – in some cases, Freecycling offers people the opportunity to try out a product (a breadmaker, a children’s slide) for free but perhaps in a well-used and rather battered form, before deciding to buy themselves one in mint condition.  

Third, Freecycling blurs what is often referred to as ‘alternative’ consumption with the mainstream. Some Freecyclers may feel that they are challenging the wastefulness and built-in obsolescence of mainstream consumer society, but others use Freecycle to ask precisely for desirable consumer items or, when offering them, use hotlinks to chainstore retailers to show what the product looks like when new (and often its original cost) as part of making it look attractive to potential collectors. Freecyclers still draw on the mainstream repertoire of modern consumption, even while aiming to counter the problems they perceive it produces.


For all these reasons, Freecycling shows us how consumption is more blurred, less analytically clean and more circular than is often appreciated. Consumption blurs into production, digital into material, alternative into mainstream, with diverse practices continually being reinvented as well. And it is fun. Now, who would like the tricycle that my son has now grown out of? And who is offering a bike that he might like? 

Eden, S., 2015. Blurring the boundaries: Prosumption, circularity and online sustainable consumption through Freecycle. Journal of Consumer Culture. 0(0) 1-21. DOI: 10.1177/1469540515586871

Wednesday, 10 December 2014

‘Paradise tax’: the price Hawaiians are prepared to pay for living near volcanoes

'Paradise tax': the price Hawaiians are prepared to pay for living near volcanoes

This week we have a guest blog by Jazmin, a PhD student in the Department of Geography, Environment and Earth Sciences at Hull. She is interested in the links between social, cultural and physical mitigation construct factors to the adaptation of volcanic risks.

By Jazmin Scarlett, University of Hull

The destruction caused by the lava of Kilauea are grabbing the attention of the international media. Last week, footage showed this eruption claiming its first house in Pahoa and people began to question whether to try to halt the flow of lava and how you might go about it.
But the daughter of the family’s home that was destroyed was remarkably sanguine about losing the family home:
If you’re going to live on a volcano, it’s about her (the Hawaiian Goddess Pele), not us … if she wants her land back, then get out of the way. I like to call it ‘paradise tax’.
The volcano is part of their culture. Pele is such a dominant force in Hawaiian’s lives they tend to accept the possibility that it might erupt. For a lot of Hawaiians, their respect for the volcano god appears to override their fear of eruptions.

For instance, the now-displaced family is building another home on older, solidified lava. Hawaii is entirely volcanic due to being situated on a hot spot resulting in a continual output of volcanic material. As far as I am aware, the family did not have insurance. This shows their ability to bounce back and recover from a hazardous event.

Not everyone responds in the same way. Some people are scared, some panic or remain anxious. And yet Hawaiian people have dealt with Kilauea’s almost continuous eruption for more than 50 years now. Over the course of many generations, they are actively learning about the volcano and the risks it poses.

Hawaii hasn’t lost many lives to the lava of Kilauea – mainly because the lava flows are slow (due to a combination of its properties and the land it flows over) – slow enough, at least, for people to respond in time and adjust to the situation (for example evacuating like the Pahoa family did a month before their home was destroyed) but also because of the combined efforts of the public, the civil defence and government authorities.

To date, Kilauea has destroyed more than 200 properties, many roads and claimed the lives of four people in modern times. Historically, the largest number killed by a Mount Kilauea explosion was in 1790, ranging from 80-400 people, a number still being debated.
Photo: BRUCE OMORI/PARADISE HELICOPTERS

Someone’s got your back

The civil defence teams, with the combined efforts of volcanologists and all those involved in keeping the people safe, have experience in how to deal with and adapt to the ever-evolving situation. A recent update shows a collective calm and professionalism, presenting the information in a way that Hawaiians can comprehend.
The risk of property being destroyed is neither exaggerated nor underestimated. The authorities explain the risk by presenting as much information as available – and Hawaiians tend to trust that the authorities are being realistic. This feeds into how people learn and assess the risk to themselves and their properties.
PHOTO: US GEOLOGICAL SURVEY

Business as usual

At present there appears to be little chance of halting the advancing lava flow. The properties of the lava and external influences, such as the steepness of the terrain, mean that the point at which the lava flow might stop naturally is not yet apparent.

What has been shown in news bulletins are the more runny lava flows that volcanologists call “pāhoehoe” (the “hoe” meaning “to paddle” in Hawaiian) but this is not representative of the reality of the eruption which is producing more viscous, slower moving lava (or “aʻā” as it is known locally). As in Italy and Iceland there have been attempts to stop lava flows in Hawaii but with mixed results. For instance, according to a report in NPR,a US$2m engineering project successfully diverted lava flows near Mount Etna in 1983. But a similar attempt in Hawaii in 1955 and 1960, however, failed because of lack of proper understanding of the situation.

Given the effectiveness of the volcanic hazard management system in place in Hawaii, I have no doubt that such attempts will be made if they are reasonable, through the combined efforts of volcanologists, engineers, the civil defence and a guaranteed investment for the project.
But in case the Hawaiian authorities don’t succeed in halting or diverting the eruption and the flow of lava, we mustn’t underestimate the power of Hawaiian culture and belief to deal with such volcanoes. Living in such parts of the world, disaster resilience is not an urgency but a way of life.


The Conversation
This article was originally published on The Conversation. Read the original article.

Friday, 31 October 2014

Between a rock and a hard place - a lecture on Sci Comm


Review of the George de Boer biennial lecture given by Prof. Iain Stewart, Professor of Geoscience Education, University of Plymouth. 
A guest blog By Dr. Lara S. Blythe

Prof Iain Stewart, geoscientist and TV personality, was the guest of honour at the University of Hull on Wednesday 29th October, invited by the Department of Geography, Environment and Earth Sciences in collaboration with their geology society, the Harker Society, to mark the reinstallation of geology as a degree programme after ca. 25 years of absence. Prof. Stewart presented the George de Boer biennial lecture entitled ‘Between a Rock and a Hard Place’ to an audience of well over one hundred people.

Photo by Rebecca Williams
The title, one might think, is not unfamiliar territory to the professional geologist. However, in this case we should think again. Caught between our science and the public, science communication and more specifically, geoscience communication is something that traditionally we scientists have had a bad reputation for. Good then that the Professor of Geoscience Communication at Plymouth University, whose interests are the cultural and social effects of geology, should give us his take on the matter.

Geology, from the perspective of the public, can be likened to an omnipresent invisible subject, which only becomes visible when necessary: at times of crisis. One issue almost immediately brought to the fore was the L’Aquila case in Italy, where a number of senior scientists and officials were sentenced to six years imprisonment for their 'inability to predict the earthquake' that killed 309 people in 2009 (Hall, 2011; Davies, 2013). This case, akin to several aftershocks, has reverberated through the scientific community and highlights the need for a better relationship between geoscience and the public where good communication is paramount.

Even though being a member of the scientific academic community and being in the public domain may seem like a contradiction in terms, the incentives for academics to communicate are clearly present and, in the face of recent developments (e.g. fracking) are increasingly necessary. For me, academia and science represent a true ecological niche whose inhabitants, as Prof. Stewart explained, approach geological events in almost a complete opposite way to the public in order to understand them. Although this niche is seen as typically attracting introverts obsessed with rocks, in short an ‘odd bunch’, these scientists in fact have a responsibility to interpret their research to the public and inform them about the world.

As Prof. Stewart pointed out, why should the public be interested? and how do we get through to a public that may not even be interested? Combined with poor understanding and many misconceptions, science is not popular amongst the public. Why ever not? I hear you ask; because it contains too much erm, science. Too many details and facts that are in essence, boring.  However according to Stewart, and co-author, Ted Nield (2012) people are interested in other people, a point towards which we need to direct out efforts to communicate effectively. Geoscience is both an applied and a visual science, attributes which enable an interesting and ‘audience grabbing’ story to be told out of an otherwise ‘dull’ subject. Take for example, one of Prof. Stewarts Earth Science broadcasts on the BBC – Journeys to the Centre of the Earth, which links Sedimentary, Metamorphic and Igneous rocks through the building stones used by the Egyptians, Greeks and Romans respectively. This series used a visual art to connect history with geology and its applications, and it proved a hit.

Used to fascinate and spark an interest rather than educate, geoscience communication in ‘quiet’ times facilitates the important transfer of information in times of change and crisis. The public know what geoscience is and know where to find out more information for themselves. As the phoenix of geology and geoscience rises from the ashes left behind at former departments country wide, so (geo)science communication must grow into a new world where academics and the public learn to first respect, then trust, and finally communicate successfully. 

Dr. Lara S Blythe. 

The lecture is available here.

References:
Davies, L. 2013. L’Aquila quake: Italian judge explains why he jailed scientists over disaster. The Guardian, World News, 18 Jan.  
Hall, S. S. 2011. Scientists on trial: At fault? Nature, 477, 264-269.
Stuart, I. S. and Nield, T. 2012. Earth Stories: context and narrative in the communication of popular geoscience. Proceedings of the Geologists’ Association, 124, 699-712.

Wednesday, 8 October 2014

Why Japan’s deadly Ontake eruption could not be predicted

Why Japan’s deadly Ontake eruption could not be predicted

By Rebecca Williams, (@volcanologist)

This article was originally published on The Conversation on the 30th September 2014. It is re-posted here in order for the article to be updated as further news about the ongoing activity comes in, and analysis by Japanese volcanologists and the JMA are released. 

Mount Ontake, Japan’s second-highest volcano, erupted killing at least 31 people (as of Oct 27th, the death toll is at 57 and 6 are missing) on September 27. Since then, there has been feverish speculation about why tourists were on an active volcano and why the eruption wasn’t predicted.
Mount Ontake (also known as Ontakesan) is a stratovolcano which last erupted in 1979-80 and 2007 (there was also a possible, unconfirmed eruption in 1991). Before this, there were no recorded historical eruptions at Mount Ontake.
Since the eruption in 1980, Ontake has been monitored by the Japan Meteorological Agency (JMA). It has seismometers around the volcano to record volcanic tremors and instruments to measure any changes around the volcano. This would provide the JMA with signs that there was magma movement underneath the volcano and that perhaps an eruption was imminent. There had been a slight increase in volcanic tremors starting at the beginning of September. Why, then, was this eruption not predicted?

No warnings

Firstly, the ability to predict volcanic eruptions is an ambition that volcanologists are far from realising. Magma movement under a volcano will cause volcanic tremor, make the ground rise and fall and release gases such as sulphur dioxide. If these signs are monitored closely, then it may be possible to forecast that an eruption may be imminent.


Safe distance. EPA/Kimimasa Mayama

However, all of these things can also happen without any volcanic eruption. Knowing what these signs mean for an individual volcano relies on data collected during previous eruptive episodes, as each volcano behaves differently. Mount Ontake has only had two known historical eruptions and previous to the 1979 eruption, had not been monitored, so scientists here had no previous data to work with. Volcanic tremors are very common at active volcanoes and often occur without being associated with an eruption.
Secondly, the type of eruption that volcanologists think occurred at Ontake is one that does not cause the signals typically monitored at volcanoes. The images and videos captured by hikers on the volcano show that the ash cloud was mostly white, which can be interpreted to mean that the eruption was mostly steam.
The effects of the pyroclastic density currents, the flows of ash, and gas that flowed over the ground from the summit, suggest that they were low-temperature and low concentration. Both of these point to there being no magma directly involved in the eruption. Instead, it is likely water had seeped into the volcano and was superheated by magma within the volcano and flashed to steam causing what is known as a phreatic eruption. Phreatic eruptions occur without magma movement, hence the lack of precursor signals. The 2007 eruption was also phreatic and also occurred with little warning.

Power of nature

So, if an eruption like the one in Japan could not be predicted, should tourists have been allowed up Mount Ontake? Ontake is a place for religious pilgrimage, as well as a popular destination for hikers and climbers. This is quite common for volcanoes around the world; tourists flock to Kilauea, Hawaii to watch the lava flows, climb volcanoes in the Cascade Range, USA and even ski at volcanoes such as Ruapehu in New Zealand. A phreatic explosion such as the one seen at Ontake on Saturday is possible at all of these places.
There is something compelling about the power of nature, and the beauty of a volcano that draws people to them. Volcanoes are inherently dangerous places and there will always be risks to those who visit them. However, events like that at Ontake are thankfully rare. Laying the blame at the foot of either the hikers, or the authorities that allow tourists to visit active volcanoes would be misplaced.

The events at Ontake were tragic. It’s my opinion that it was a tragedy that could not have been predicted or prevented, given our current level of knowledge. It highlights the need to understand volcanic systems better. My thoughts are with the survivors, and the families of those who didn’t make it.
The Conversation

This article was originally published on The Conversation. Read the original article.

Please post links to updated information in the comments below.

Updates

Latest death toll
It seems that this eruption claimed the lives of 57 people, and 6 others are still unaccounted for. Recovery efforts are expected to recommence in the spring.

'Lessons' in disaster preparedness
The events on Mount Ontake in September have already led to calls for better disaster preparedness on Japan's volcanic mountains. Toshitsugu Fujii, the director of the Coordinating Commitee for Prediction of Volcanic Eruptions, stated in a press conference that he believes there is a gap in the understanding of the commonly used volcanic alert signals. He said "a level 1 danger alert refers to what is 'normal' for an active volcano...in other words, anything could happen inside the crater". He goes on to say that the committee is now looking into the perceptions of these alert levels from those who release them, to those who use them, such as climbers.

Others have issued a call to arms for volcanologists, asking for a national agency for volcanology, rather than research on individual volcanoes being the responsibility of individual university research groups. Shozawa Shin'ichiro states that the only volcanoes in Japan that have manned observatories are "Mount Usu, Mount Unzen, Sakurajima, Mount Aso, and Mount Kusatsu-Shirane" and that "the University of Tokyo, for instance, used to assign instructors and technical associates to its volcano observatories in Kirishima, Izu Ōshima, and elsewhere, but nowadays these facilities are largely unmanned. No researchers were stationed at Mount Ontake, nor are there any on Mount Fuji". Other countries with active volcanoes do have government agencies who are responsible for monitoring active volcanoes, such as the US Geological Survey, who have the Hawaiian Volcano Observatory and the Cascades Volcano Observatory. Currently, in Japan, this responsibility lies with the Japan Meterological Agency (JMA).

There are 35 disaster prevention councils which have been set up to cover 35 active volcanoes across Japan. A survey conducted after the Mount Ontake eruption showed that half of them have yet to set up evacuation plans, though they are considering this and are also considering asking climbers to submit plans before accessing the mountain. These groups also call out to central government for support to improve their disaster preparedness. "If the central government draws up guidelines, it would facilitate the move (to improve disaster prevention measures)," said an official with the Fukushima Prefectural Government, which serves as the secretariat for the Mount Adatara and two other volcano disaster prevention councils.

At Mount Asama, the council have developed a smart phone platform which it uses to alert climbers to weather and volcanic events, if the climber has signed up to the service. However, only a fraction of the mountain visitors have signed up to the alerts. The council are looking at ways to extend the use of its warning system and the JMA seem to be considering rolling it out at other locations. Noritake Nishide, the Director-General of the JMA said that "portable handheld devices such as smartphones should be instrumental in terms of providing information to individual mountain climbers".

Unprecedented coverage on social media
Much of the news of the eruption, and details about the event, were first to be found on Twitter. Hikers on the volcano were tweeting images and commentary during the eruption and this proved invaluable to understanding the processes that occurred. Sadly, recent pathology reports indicate that half of the victims died whilst taking photos of the eruption. Though, apparently Nikon repaired a camera found on a deceased victim, cleaned it and returned it to the family, after recovering some 200 photos. Some survivors found themselves hounded by journalists for details and photos, whilst they were still trapped on the volcano. It led to a lot of armchair volcanology and criticism of the JMA for not predicting the eruption. More thoughts on this below.

Hindsight bias
The article above was largely written in response to several inflammatory articles suggesting that there was someone to blame for this tragedy, or that 'warning signs were missed'. I will not link to those articles here. These types of articles either fall into the trap of thinking that someone must be to blame, or they have looked at the events with 'hindsight bias'. Jonathon Stone has written an excellent article about hindsight bias that I urge you to read here: http://www.nonsolidground.blogspot.co.uk/2014/09/i-knew-it-all-along-avoiding-hindsight.html


Wednesday, 1 October 2014

Freshwater limestones and the salt budget of the Mediterranean Sea

by Dr Mike Rogerson (@MikeRogerson7)


Freshwater limestones and the salt budget of the Mediterranean Sea have as much to do with each other as a hookah-smoking caterpillar does with a baby capable of turning into a pig. In both cases, the link could not be more simple; they both exist in the same storyline, the former case being my research career and the latter Alice’s Adventures in Wonderland. The caterpillar and the pig/baby are elements slowly manoeuvring Alice towards her showdown with the Queen of Hearts. Whether or not my career will end up with me in court, we are yet to see.

Freshwater limestones and the salt budget of the Mediterranean Sea share a fundamental characteristic - they are both essentially controlled by a single equation; the Froude equation. The Froude number (Froude is pronounced “Frood”, as in “sass that hoopy Ford Prefect, there’s a frood who really knows where his towel is”) tells you whether water flowing through a gap is moving slowly enough that waves can go through the water in the opposite direction to the flow, or not. You’ve probably seen the impact of the “hydraulic jumps” that form because of transitions between these two states – think back to the last time you were gazing at a waterfall. Remember how the water pours over in a sheet? That water has a Froude number that is “super-critical”. The water that seems to be boiling and upwelling downstream of the waterfall is “sub-critical”. The strange “standing wave” that seems to dance at the foot of the waterfall is a “hydraulic jump” between these two states. There is another one just above the waterfall, but you need a bit more practice to notice that.

The waterfall analogy works well for us, because freshwater limestones do in fact make waterfalls. These beautiful sediments form when calcium and carbon in the river water react to form calcite – limestone – to make crusty lumps and sheets on the river bottom. They are beautiful, by the way. Here are a few pictures if you don’t believe me (Images © Mike Rogerson).

The calcite forms inside a community of microorganisms living on the bottom of the river – a biofilm. The way the river water, the biofilm and the calcite interact is one of the wonders of nature, with implications for the global carbon cycle, the evolution of life on our continents, the way we can reduce the impact of metal pollution on our waters and the future of oil production in the south Atlantic. Not even Lewis Carroll tried to convince us to relate such apparently unrelated scenes. The world is a strange and unpredictable place, and anyone that tells you that you can understand it intuitively is not to be trusted. 

What controls the rate of calcite formation at the river bottom is mostly how fast you can get calcium and bicarbonate ions from the river to the bottom, and how fast you can get the protons produced by the mineral formation (Ca2+(aq) + HCO3-(aq) ⇌ CaCO3(s) + H+(aq)) back out into the river. This happens by diffusion, which is a really slow process in water. If you don’t believe me, gently pour a kettle of boiling water into the middle of a completely still, cold bath, leave it for 10 minutes and then try and find it with your hand. You should have no problem.

The distance the diffusion of the ions in the river have to travel is controlled by the still layer that sits at the bottom of all flowing waters. If the water is moving slowly, this still layer is thick. If the water is moving fast, it is thin – but it is there. If the water is moving super-critically, it is very thin indeed – and therein lies the rub. The calcite will form much faster on the top of our waterfall where the flow is super-critical than it will upstream or downstream. This is actually good news for the biofilm; their economy is driven by photosynthesis, which needs light. The light hitting the river bottom is stronger when the water layer is thin, and also when it is super-critical. The bigger the waterfall gets, the happier the biofilm is. The consequence of this is that the waterfall gets higher, the biofilm gets happier, the Froude number gets higher and the waterfall gets higher again. And look how high some of these things get. These whole walls have been built by a biofilm precipitating a mineral from water, exploiting the physics of how water flows. You’ve got to be impressed.
Plitvice Lakes Croatia. Photo by permission from Jack Brauer. Check out his stunning photography here: http://www.mountainphotography.com/
If you have super-critical flow of water through a sea-strait, then the amount of water you can push though per second is controlled by the friction on the sea floor. A good example is the shallow and narrow Strait of Gibraltar at the western end of the Mediterranean Sea. You can see the standing wave on the eastern side of the Strait – I hope that is convincing enough that there is a Froude transition happening in there. If you have a region - like the Mediterranean Sea - which is pretty dry, then the total amount of evaporation is a bit bigger than the amount of rainfall. Because you can’t just pour as much water as you like through the Strait of Gibraltar, this means the Mediterranean is a bit saltier than the Atlantic. So long as sea level stays the same, this balance is maintained. If you reduce sea level though, the Gibraltar gap gets smaller, it gets harder to push water though it and salinity in the Mediterranean gets higher. Vice versa if you raise sea level – the Mediterranean steadily gets more and more similar to the Atlantic.
The Strait of Gibralter from above - note the standing wave at the eastern side. © Mike Rogerson
24,000 years ago there was an ice sheet on Britain. Its probably what you call the “ice age”, but really you should call it the “last glacial maximum”. You can tell these glaciers were there though, because we have lovely glaciated valleys in the North of Britain, stunning fjords in the west of Scotland and you can see moraines (which formed at the southern ends of the ice sheet) all over eastern Yorkshire. There were also ice sheets in North America, Scandinavia, Kamchatka, Iceland and other places. And all the water to make these ice sheets came out of the ocean. All that water removed from the ocean was enough to drop sea level by 120 to 130m. For the Strait of Gibraltar, which today is about 245m deep, this means the bottle-neck got an awful lot smaller. The Froude number was even higher than today, and it was even harder to balance the Mediterranean salt budget. 

The fact that water in the Mediterranean was a lot saltier than today during the last glacial maximum is not an obvious consequence of growing ice sheets in Britain and elsewhere. But the consequences of climate change are rarely obvious and intuitive. But what the Froude controls on freshwater limestones and Mediterranean salinity tell us is that features of the natural environment can be predicted by mathematics, even if they are completely impossible to relate without that tool. It probably is no accident that Lewis Carroll was a mathematician – he was used to following internal logic without worrying that it told him things outside his everyday experience. He knew that the world is always more complicated than it seems on the surface.
So the message we should all take home is that if mathematics tells us that raising CO2 in the atmosphere is not a great idea, then we should pay attention. Maths does a much better job of predicting the world than our experience-based guesswork ever can. The mathematics for climate change were worked out in the 1900’s, and the first prediction of climate change was made by an equation – not by a model – in 1908. Look up SvanteArrhenius’ “Worlds in the Making”. It may not seem obvious from your everyday life that climate change must be true, but neither is it obvious that biofilms make waterfalls. Nature works in mysterious ways.
Plitvice Lakes, Croatia. By Donarreiskoffer via Wikimedia Commons

Wednesday, 11 June 2014

Cheltenham Science Festival – a lesson in public engagement

By Rebecca Williams (@volcanologist)

Last week I was part of a University of Hull team who went to Cheltenham Science Festival (CSF), one of the biggest science festivals in the UK. CSF is a six day event of talks, demonstrations and general science fun aimed at everyone from school children to retired adults. We were involved in activities across this spectrum. The GEES team had a River in a Box display in the Discover Zone to show how rivers work, headed by Dave Milan and Dan Parsons, and delivered by an army of awesome postgrad students. Dave Milan debated 'A waterproof World?'Dave Bond and I gave a talk on mass extinction and volcanism. March Lorch and Phil Bell-Young seemed to be doing a million things from workshops for school children on ‘your body the chemical analyser’ to a talk on ‘iPads and avatars’ - the motion capture monkey who stars in this had been entertaining the Green Room with his antics, including a few celeb scientists!
The GEES' 'River in a Box' at CSF. Photo courtesy of Chris Unsworth (@unsteadyriver)
For me, it was one of the first times I gave a talk to a true ‘public’ audience. I do a fair amount of public engagement and outreach activities. I do schools events, I run a Twitter account and have done chats to school children using it, this blog’s original intention was for a general audience, and I’m booked in for talks this year at both the Hull Geological Society and the Rotunda Geology Group (Scarborough). This was the first time though that I was giving a talk to a genuinely unknown audience, who didn’t have a particular interest in geology. And they were paying!
Can volcanoes wipe out life on Earth? Mine and Dave's talk at CSF. Photo courtesy of Leiping Ye (@Leiping_Ye)
Dave and I were quite happy with our talk. It showcased some of Dave’s NERC funded research and we’d developed a pretty cool ThermiteVolcano especially for the event, with a lot of help from our pet chemist Mark. We got lots of great questions and were followed by a group to The Times Talking Point for further discussion. People in the audience have contacted me since to say how much they enjoyed it.
Some of the FameLab International Final winners (Alumni and Audience awards) being presented with their prizes by Prof Alice Roberts
That night though, we all went along to the FameLab International Finals and I was blown away. If you don’t know it, FameLab is a competition of science communication, a kind of XFactor for scientists. Contestants get 3 minutes to entertain and educate the audience about a particular scientific concept. This year, finalists presented science stretching from how language works in the brain (done in sign language as well as spoken!) to how exercise can boost stem cells to combat dementia to how honey bees can be trained to detect explosives and drugs (and are better than sniffer dogs!). The science is not dumbed down, nor is it jazzed up. It is explained beautifully and clearly, sometimes with props and sometimes without.

This got me thinking back to my talk. Did I really need all those powerpoint slides? Did I really need all those facts and figures? Events such as the brilliant Cafe Scientifique movement would argue that we don’t need powerpoint at all and my experience at FameLab would back that up. So, what next for my engagement activities? Mark has finally convinced me to give the Beverly Cafe Scientifique a go, so I’ll see how I’ll fare without my powerpoint comfort blanket. Dave and I are planning on doing our ‘Can volcanoes wipe out life on Earth?’ talk in Hull this year, maybe as the Christmas Lecture. In the meantime, I’ll be taking part in ‘I’m a scientist...get me out of here!’ over the next couple of weeks, an exciting chance to chat science to school children.
Cheltenham Science Festival - I loved the giant molecules scattered about the place
I’ll leave you with a question though. Engagement isn’t about us, as GEESologists, it’s about you guys – the people reading this blog and coming to these events. What do you want to see, hear or read about? And how best can we tell you about it? Let us know your thoughts!

A quick shout out to those awesome postgraduate students: Leping Ye, Chris Unsworth, Claire Keevil, Dave Jordan and Xuxu Wu. Special thanks also to Cameron Webb, who only popped down for the day to see our talk and ended up getting roped in to help!

Wednesday, 23 April 2014

Images from the ends of the Earth

By Lucy Clarke (@DrLucyClarke)

Thinking about Antarctica conjures up images of a remote ice covered wilderness; it’s the coldest, windiest and driest continent and the only one to not have permanent residents living on it. It is the last terrestrial frontier on Earth that we haven’t yet fully conquered. So when I got the chance to work at the British Antarctic Survey (BAS) in Cambridge it felt like the opportunity of a lifetime – I would get to work on this distant continent… Sadly my current project doesn’t involve fieldwork, but I do get access to a huge archive of aerial photographs so I can explore large areas of Antarctica remotely, plus I’m not giving up hope of heading ‘South’ just yet!

Lots of research and the recent Intergovernmental Panel on Climate Change (IPCC) report published last year have all highlighted the retreat of Antarctica’s ice sheets and glaciers, and are concerned with the impact of future melting on global sea levels. My research, in collaboration with colleagues at the University of Newcastle, will contribute to this debate by quantifying glacier change during the 20th and 21st Century.

Photograph of Ryder Bay (left) and the Sheldon Glacier (right) on the Antarctic Peninsula (Photographs courtesy of the BAS Photo Repository)


Antarctica can be divided into 3 areas: the West Antarctic ice sheet, the East Antarctic ice sheet and the Antarctic Peninsula… it is the latter that is the focus of my research. The Antarctic Peninsula is situated on the north-western tip of Antarctica and unlike the rest of the continent it isn’t completely covered by ice sheets, it is a mountainous area and there are many glaciers feeding into ice sheets and the surrounding sea. 

Map of Antarctica showing the 3 ice sheets, with an inset highlighting the Antarctic Peninsula (Source: Antarctic Digital Database)

The Antarctic Peninsula has over 400 glaciers and current thinking is that climate change is causing a rapid reduction of these, however there is very little detailed long-term information to support this. Most of the glaciers are inaccessible thereby preventing collection of measurements in the field and so remote techniques have to be used to determine how these may have altered. Satellite imagery has been used to reconstruct glacial change since the 1990s but the impact of change over the 20th Century is still unknown for the majority of glaciers. Fortunately we do have an archive of aerial photography of the Antarctic Peninsula at BAS dating back to the 1940s.  We can use this data source to not only visually compare differences in glacier extent during this period but also calculate the volumetric change using photogrammetry.  My December blog post covers use of this technique: What’s in a photo?

Normally photogrammetry requires: (1) two overlapping photographs of an area, (2) details on the camera used, and (3) some identifiable points on the ground that you know the co-ordinates of, to create a 3D model of the overlap area that can then be used to take measurements. In the case of the Antarctic Peninsula we don’t have any ground measurements for large areas, so using the standard technique wasn’t possible and therefore we had to come up with a new way to undertake photogrammetry with no available ground control.

The BAS Twin Otter that the aerial photography is flown from (left) and the camera and storage set up inside the plane (right) (Photos courtesy of the BAS Photo Repository)

New aerial photography in Antarctica is flown by the BAS using a digital camera mounted in a Twin Otter plane with the camera set into a holding that records the exact position, height and rotation of the camera at the instant that each photograph is taken (shown in the pics above). Using this information I can create a high resolution digital elevation model, or 3D model of the surface, using photogrammetry without the need for ground control measurements, thus allowing us to undertake this research in even the most inaccessible areas. The accuracy of this technique (with the potential for 40 cm resolution, so every pixel in the image equates to 40 cm on the ground) far exceeds that offered by current satellite imagery (with a resolution of 15 m). This results in clearly definable features on the subsequently processed photography. I can therefore look at the modern digital elevation model and identify co-ordinates for rock outcrops and mountain peaks that won’t have changed through time. This can then be reverse engineered to create ground control points for the historic aerial photos without ever having to set foot on the glacier! So as long as I have contemporary aerial photography of a glacier I can use this to process older photography from the same area, allowing us to fully utilise the rich archive of historic air photography stored in the BAS archives.

The Moider glacier on the Antarctic Peninsula in (a) 1947 and (b) 2005 showing the thinning and retreat at the glacier front, and (c) the digital elevation model produced from the 2005 imagery.

Preliminary results show dramatic mass change in the study glaciers over the last few decades, and I am currently processing these results in further detail and extending the study sites. I will be blogging about these results in the near future so watch this space…


This research is part of the NERC funded grant: Ref NE/K004867/1: “The spatial and temporal distribution of 20th Century Antarctic Peninsula glacier mass change and its drivers”