Showing posts with label science communication. Show all posts

Wednesday, 5 August 2015

Fracking research: the only way is ethics

By Liam Herringshaw (@fossiliam)

Britain for shale? (Image from Wikimedia Commons, via DECC)

If the contentions of the UK government's energy policy are summed up in a single word, it's probably this one: fracking. According to the August 2015 government survey of public opinions about energy, 28% of UK people are opposed to it, 21% of people support it, and 46% neither oppose nor support it (I'm not sure what the other 5% think!).

Originally a shorthand for the process of hydraulically fracturing low permeability rocks – particularly shales – to extract hydrocarbons from them, the term 'fracking' has evolved and mutated. To some, it is a byword for energy independence and prosperity. To others, it is a swear word of greed and pollution. Fracking is now so variously (mis)used and (mis)understood that it's often hard to know exactly what it encompasses.

If fracking has issues of semantics, then the subject has clearly not been communicated very well. This is a consequence of many factors, but two are particularly pertinent: a lack of fundamental research, and a reluctance of experts to speak out about what is correct or incorrect, and what is known or unknown.

The latter is a consequence of the former. Most people – geologists included – know little about shales, or shale gas, or fracking; only recently have they become a focus of much scientific attention. Even if you are an expert, the need to try and bring sense into the debate is often counter-balanced by the chastening experience of sticking your head above the parapet. Nonetheless, we should try to provide information whenever we can.

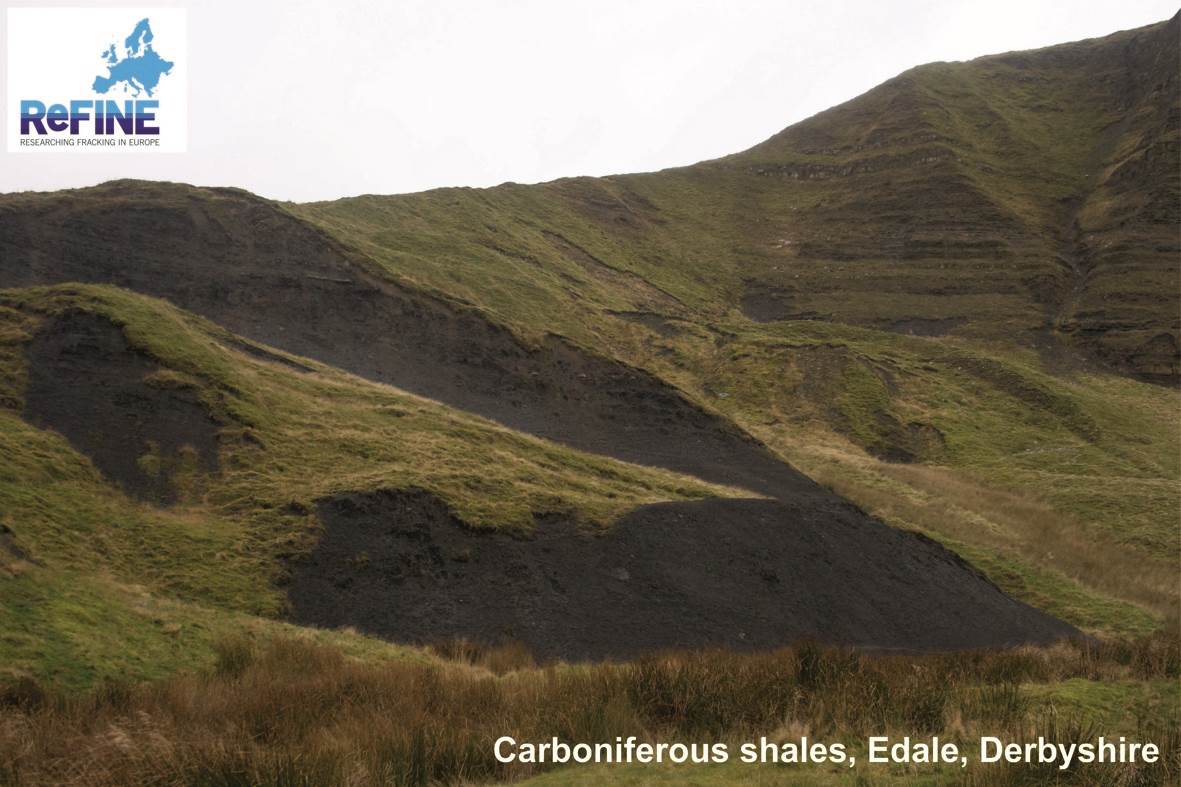
Carboniferous shales in the Peak District, UK (Photo by Liam Herringshaw / ReFINE)

Despite all the recent hype about Britain's onshore shale gas potential, for example, we actually know very little about the deep geology of the country's shale basins. Only multi-disciplinary investigations, gathering and interpreting large datasets and then communicating the findings to the public, can help address such uncertainties. But how should research into fracking be funded? And what ethical issues are raised?

If you're implacably opposed to shale gas extraction, you might argue that there should be no funding at all. Since the combustion of fossil fuels is a key driver of climate change, using new techniques to extract and burn them is wrong, and shouldn't happen. That argument has been made to me at meetings I've attended.

Most people, however, recognize the need for peer-reviewed scientific research, even if they are opposed to unconventional hydrocarbon extraction. Fracking is already happening, and will continue to happen. Many impacts – positive and negative – have been claimed on its behalf, but few have been proven with empirical data. To properly inform the debate we need more facts about fracks.

ReFINE - Researching Fracking In Europe

To this end, the main project I have been involved with over the last couple of years is ReFINE (Researching Fracking In Europe). Led by Newcastle and Durham universities, with contributions from many other institutions (including GEES at Hull), ReFINE aims to investigate the key topics of public concern and communicate the findings as widely as possible.
 
As the consortium is part-funded by the hydrocarbon industry, though, there were concerns that the public would see ReFINE as potentially biased. A unique set of ethical procedures were therefore put in place to ensure that funders did not have direct influence over the research outputs. These are:
  • Peer review – all ReFINE papers are submitted to recognized journals for peer review by scholars not involved in the project;
  • Disclosures of interest – all members of the project are required to declare any current or past interests that may compromise their impartiality;
  • Independent Science Board – comprising impartial scientific researchers from across the world, the Independent Science Board (ISB) directs and oversees all ReFINE research, ensuring it is accurate, relevant, and free from industry bias;
  • Offsite archives – correspondence and data relating to the project are recorded using a secure email archive, and made publicly available on request.
No matter how transparent you attempt to be, there will always be those who regard your work with suspicion. Perhaps the best indication of independence is when pro- and anti-fracking groups both perceive your findings as supporting their opponents' position. Having been described as 'frackademics' after publishing one peer-reviewed publication, and then 'nettle wine tasters' after publishing another, members of ReFINE are certainly discovering this.

Ethics are an increasingly important consideration in research projects, particularly those investigating contentious topics. I've not been involved in a project like ReFINE before, with such a detailed ethics policy, but it is surely the right approach. As researchers we need to demonstrate that we are engaging properly with issues of trust and impartiality, especially in relation to funding. As the most recent ReFINE publication has also demonstrated, we must discuss fracking with the public using non-technical language. Only then will people begin to be able to make more informed decisions about the real risks.


ReFINE will be a case study in a future issue of the journal Research Ethics, subject to final approval. To find out more about the project, visit http://refine.org.uk/.

Friday, 31 October 2014

Between a rock and a hard place - a lecture on Sci Comm


Review of the George de Boer biennial lecture given by Prof. Iain Stewart, Professor of Geoscience Education, University of Plymouth. 
A guest blog By Dr. Lara S. Blythe

Prof Iain Stewart, geoscientist and TV personality, was the guest of honour at the University of Hull on Wednesday 29th October, invited by the Department of Geography, Environment and Earth Sciences in collaboration with their geology society, the Harker Society, to mark the reinstallation of geology as a degree programme after ca. 25 years of absence. Prof. Stewart presented the George de Boer biennial lecture entitled ‘Between a Rock and a Hard Place’ to an audience of well over one hundred people.

Photo by Rebecca Williams
The title, one might think, is not unfamiliar territory to the professional geologist. However, in this case we should think again. Caught between our science and the public, science communication and more specifically, geoscience communication is something that traditionally we scientists have had a bad reputation for. Good then that the Professor of Geoscience Communication at Plymouth University, whose interests are the cultural and social effects of geology, should give us his take on the matter.

Geology, from the perspective of the public, can be likened to an omnipresent invisible subject, which only becomes visible when necessary: at times of crisis. One issue almost immediately brought to the fore was the L’Aquila case in Italy, where a number of senior scientists and officials were sentenced to six years imprisonment for their 'inability to predict the earthquake' that killed 309 people in 2009 (Hall, 2011; Davies, 2013). This case, akin to several aftershocks, has reverberated through the scientific community and highlights the need for a better relationship between geoscience and the public where good communication is paramount.

Even though being a member of the scientific academic community and being in the public domain may seem like a contradiction in terms, the incentives for academics to communicate are clearly present and, in the face of recent developments (e.g. fracking) are increasingly necessary. For me, academia and science represent a true ecological niche whose inhabitants, as Prof. Stewart explained, approach geological events in almost a complete opposite way to the public in order to understand them. Although this niche is seen as typically attracting introverts obsessed with rocks, in short an ‘odd bunch’, these scientists in fact have a responsibility to interpret their research to the public and inform them about the world.

As Prof. Stewart pointed out, why should the public be interested? and how do we get through to a public that may not even be interested? Combined with poor understanding and many misconceptions, science is not popular amongst the public. Why ever not? I hear you ask; because it contains too much erm, science. Too many details and facts that are in essence, boring.  However according to Stewart, and co-author, Ted Nield (2012) people are interested in other people, a point towards which we need to direct out efforts to communicate effectively. Geoscience is both an applied and a visual science, attributes which enable an interesting and ‘audience grabbing’ story to be told out of an otherwise ‘dull’ subject. Take for example, one of Prof. Stewarts Earth Science broadcasts on the BBC – Journeys to the Centre of the Earth, which links Sedimentary, Metamorphic and Igneous rocks through the building stones used by the Egyptians, Greeks and Romans respectively. This series used a visual art to connect history with geology and its applications, and it proved a hit.

Used to fascinate and spark an interest rather than educate, geoscience communication in ‘quiet’ times facilitates the important transfer of information in times of change and crisis. The public know what geoscience is and know where to find out more information for themselves. As the phoenix of geology and geoscience rises from the ashes left behind at former departments country wide, so (geo)science communication must grow into a new world where academics and the public learn to first respect, then trust, and finally communicate successfully. 

Dr. Lara S Blythe. 

The lecture is available here.

References:
Davies, L. 2013. L’Aquila quake: Italian judge explains why he jailed scientists over disaster. The Guardian, World News, 18 Jan.  
Hall, S. S. 2011. Scientists on trial: At fault? Nature, 477, 264-269.
Stuart, I. S. and Nield, T. 2012. Earth Stories: context and narrative in the communication of popular geoscience. Proceedings of the Geologists’ Association, 124, 699-712.

Wednesday, 2 April 2014

Hull University Science Festival 2014

by Chris Skinner (@cloudskinner)

One of the great joys of academic life is getting the opportunity to communicate our research to the public - it is one of the key motivators of this blog after all. We spend much of our time in a bubble and become accustomed to our jargon and way of life which seems a bit alien to those outside the bubble, so it is also very healthy for us to step out once in a while and engage with those out there. The challenge is finding ways to communicate our research in ways that are informative and engaging.

This year, the Faculty of Science and Engineering at the University of Hull organised the Hull Science Festival. Running as part of National Science Week (which one attending school pupil pointed out to me was 9 days, and not actually a week), it saw students and staff from the university present their research to members of the public.

The Science Festival ran on a Friday and Saturday. Friday was an early start as the Hull Bondholders ("The Bondholder Scheme is an almost 200-strong powerful network of businesses, who work together to raise the profile of the Humber") held their regular breakfast meeting at the University as part of the Festival, which allowed us to explain the benefits of our research to business in the area. After the breakfast (after we had mopped up the leftover sausages - all the bacon had gone), the audience changed to school pupils and their teachers, as local schools were invited to attend.

Throughout the day the marquee containing the exhibitions was open for the pupils to mill around and chat to us, whilst the schools took it in turns to attend the presentations and demonstrations conducted elsewhere on campus. Unfortunately, I did not get the chance to see any of these. The pupils all seemed very excited and keen to know more about the displays on offer, and I also got the chance to chat to the teachers from my old school, Baysgarth, who had brought some pupils along.

The Saturday was open to the public to just come and go as they pleased and wander, and hopefully wonder, around. This was a busy day where I spent almost all of it talking to people about my research and the Humber. It coincided with an Open Day too, so prospective students got a further opportunity to see just what an active and exciting university we are.  All in all, it was a great couple of days and I hope it becomes a regular fixture in our calendar.

Unfortunately for me and my chances of looking around, both days were very busy and I spent much of it manning my stall, demonstrating the Dynamic Humber Project's work on understanding the 5th December storm surge, but I did get to see some of the neighbouring displays.

GEES were out in force for the Festival, as shown below - 

The view over the GEES displays

I've got a bone to pick with you! (Photo by Dr Jane Bunting) 

Dr Malcolm Lillie brought along skeletons and bones from his archaeology collection, including some pieces which were over 7,000 years old.

You say stomata... (photo by Dr Jane Bunting)

Dr Jane Bunting set up a microscope and gave people the opportunity to take peelings from a holly leaf. Observing these peelings under the microscope revealed the leaf's stomata (mouth-like pores that exchange gases and moisture between the the air and the plant) - this was to highlight the research into how leaf structure can change in response to weather and climate.


GEES PhD Student, Ross Jenning's, demonstrating how to harness tidal power for electricity (photo by @HullOpenDays)

Prof Jack Hardisty brought along a prototype of a tidal generator which was used to demonstrate the potential of harnessing the abundance of tidal energy in the Humber to generate electricity.


Here, Dr David Milan demonstrates how changes to the land surface can influence run-off. Whilst the water on the hard surface drains the tank very quickly, the natural surface absorbs the water, holding it for longer and reduces the levels of flow - this can help reduce the impacts of flooding.

In addition to the displays above, we also had posters from other members of the Department, including showing off research in Human Geography by Prof David Gibbs and Dr Kirstie O'Neill, who showcased their research on green entrepreneurs  and the role they play in making building more sustainableDr Deborah Butler was often seen wielding an iPad ready to demonstrate the FoodCrowd app she blogged about last week.


We weren't the only ones at the Festival, not by a long shot, and below are some the highlights around the marquee - 


Dr Darren Evans from the University's School of Biological Sciences brought along some bees in a commercial hive. Although largely confined to a netted cage, one plucky bee escaped and enjoyed a ride on the tidal generator. 


Biodiversity Jenga and Coffee! (photo by Darren Evans)

Dr Evans also brought along his giant Biodiversity Jenga set, which demonstrates how the successive removal of species from a system can lead to environmental collapse.


My favourite part of, my limited view of, the Festival was the 3D printer brought along by Computer Science. I love these things and have been following their development for years, but this was the first time I had seen one for real, and it was working! The potential for these things is enormous, and I'm not just saying that as a secret collector of toy soldiers. Computer Science also brought along a few robots and their Oculus Rift (virtual reality equipment, recently purchased by Facebook) set up which they aim to use to train people to install and maintain offshore windfarms from the shore.

Racing for Formula Student (photo by Hull University)

Also there were the Hull University Formula Student team. A group of Engineering students who have built a racing car and race it in competitions. Their demonstration included a sit in simulator where people could have a go themselves - there was also a leaderboard going for the fastest lap times.


Smile! (Photo by Hull University)

Opposite me was a popular set of animal skeletons. I was told that these were donated to the University by the Natural History Museum in London when the University was founded in 1927. They are exquisite things, and included an ant eater, a horse, tortoise and a rhino skull.


Flying Magnets! (Photo by @HullUniScience)

Throughout the day I saw many people walking around with bags of goo, DNA sweets and all sorts of other goodies that were being given out. There were people extracting DNA from peas, and racing plankton (won by our very own Prof Dan Parsons) or even racing over a magnetic elevation track. Lots of fun was had by all and I'm looking forward to next year. If you attended the festival, why not leave a comment below about what you enjoyed most or what you would like to see in the future?

For more pictures, follow this link to the official Science Festival gallery.

Whilst I was writing this post, as part of a ongoing series of elaborate April Fool's gags from Google (which has seen me collect all 150 Pokemon and desperately search for Mew), one of the photos used got "Auto-Awesomed". The result was too good not to share.


Wednesday, 4 September 2013

Getting Animated

Getting Animated by Chris Skinner (@cloudskinner)

The formal presentation of research in academia is pretty traditional. I doubt it has changed much in the last 500 years, if not longer, and for a progressive sector of society it really does not look set to change. Basically, you get your results, write it up as a paper, some experts look it over and request more details or changes, you do them, they pass it, you get published.

The published article then goes into a journal. Most of these are still printed but are available, usually as a PDF file, electronically. This is where the embrace with the modern world ends. I mainly read articles either on my computer or my tablet – most articles are formatted into two columns on a page which makes it very awkward to read off a screen. So optimisation for electronic presentation is not high on publishers’ agendas it would seem.

But are we missing out? A magazine I have been reading since I picked up my first copy in October 1993 has changed many times in the last two decades. It isn’t a science publication but is related to a hobby of mine, and last year they started publishing a version of the magazine optimised for the iPad. They could have just bunged out a PDF of the paper copy, but they knew that the new technology provided them with a platform to support more content. In place of a photo there is an interactive 360ยบ image, instead of a price list for new products there are hotlinks direct to their entry on the online store, plus there’s additional videos, interviews and zoom panels. If the magazine contains typos or erroneous details, it is automatically updated. The company have started rolling out this idea to their other printed materials.

What if these ideas were used in academia? What sort of content could we include? The most immediate thing that springs to my mind is animations. I produce tonnes of them, and conference presentations aside, they rarely get seen outside of my research group. Why do I make them? Because they are useful for very clearly showing how systems work, if your model is operating how it should or demonstrating patterns in data - (*Thanks to @volcanologist for pointing out that animations can sometimes be submitted, and hosted on a publisher's website).

Take for example some work I have been doing on historic bathymetry data from the Humber estuary. Bathymetry data are readings of water depth at the same tide level, and I use the data to create maps that show the shape and elevation (heights) of the bottom of the estuary. To find out more about what estuaries are, take a look at Sally's previous blog.

Provided by ABPMer, the data spans a period between 1851 and 2003 – I processed the data, calculated rates of elevation change between each sampling period, and from this produced yearly elevation maps. By putting these together as an animation I could see the evolution of the data (it is important here to stress the difference between ‘data’ and reality - not all areas of the estuary were sampled by each survey, and the number and locations of reading varied. Much of the change seen in the video is because of this and not because the Humber has actually, physically, changed in that way).


What immediately struck me was the contrast between the middle and the inner estuary. The middle estuary is the part between the Humber Bridge and the sea, where the estuary’s course deviates southwards – it is remarkably stable over the 150 or so years. The inner estuary, from the Bridge towards Goole, sees lots of internal changes – driven by interactions between the river inputs and the tides – but overall very little change. The Mouth of the Humber, the part closest to the sea, looks to see little overall change, but most of the variations seen in the animation are due to differences in sampling point in the data, and not actual changes. Similarly, changes around the banks of the estuary observed in the animation are most likely caused by sampling difference in the surveys, rather than actual elevation changes.

I have recently been continuing work on adapting a landscape evolution model, Caesar-Lisflood, to model the Humber estuary, and a big step towards this is to accurately model the tides as they are observed by tidal stations recording water depths. Numerically we can do this, but it is important to check that the model is representing the tides in a realistic way - this is a very important step in making a model as it has to be able to accurately simulate observed behaviours before you can experiment with them. Again, animations are a really useful tool for doing this.


The video above shows the variations of water depth throughout several tidal cycles, as modelled, with light blues as shallow and dark purple as deep water. The model changes the depth of the water at the right hand edge in line with water depth data recorded from the Spurn Point tidal station near there. The water then 'flows' from there, down the length of the estuary as the depth increases, and vice versa - this simulates the tides going in and out.

From this I can tell that the model is operating well, as the tide is advancing (coming in/going up/getting deeper) and receding (going out/down/shallower) as expected, throughout the whole region and not just at the points where the tidal stations are located. You'll notice that the early part of the animation shows the estuary filling up with water - this is part of something called 'spin-up', where you let the model run for a period of time to get the conditions right before you start the modelling. In this case it is a 'day' as the water levels gradually builds, filling the estuary.

Another check would be the velocity of the flow as the tide floods and ebbs - this is the speed with which the water is moving (both in or out). The velocity should increase as the tide advances or recedes, but slack water (where the water is hardly moving at all) should be observed at high and low waters. If the model is working as expected, the area of slack water should progress from the sea and up the estuary towards Goole. From the video below, this is seen to be the case. Light blue shows low flow speeds, and darker purples higher flow speeds. The video shows the same modelling procedure as the previous video.


This type of content is really useful to me as a modeller. It is also really useful for presentations as I can show a group of people something that takes a few seconds, yet would probably take a lot of slides and quite a bit of explaining. If academic publications were to begin to include enhanced content in peer-reviewed publications, I believe this could advance the communication of research, not only to other researchers but also to the wider public. For now, Blogs, like the GEES-ology one here, are the best outlet. I hope you enjoyed the animations!